With the amount of data gathered by data providers increasing year by year, it is becoming increasingly important to find a tool that can scale with the size of your data.
To achieve this we have recently started working with Fused.io to create workflows that can efficiently handle very large amounts of data on the fly.
年々、データ提供者が収集するデータの量が増える中、データの規模に応じて拡張できるツールを見つけることはますます重要になっています。私たちはこれを実現するために、Fused.ioと協力し、大量のデータをリアルタイムで効率的に処理できるワークフローを作成しています。
Fused lets you write user defined functions (UDFs) in Python than will then leverage a serverless backend to supercharge any spatial analysis workflow.
Fused accepts many different types of data including both raster and vector data. Once your data has been uploaded to fused, it gets prepared in such a way that in can be accessed in the fastest and most efficient way possible. This is how Fused is able to visualize data on a global scale in real time.
Fusedは、Pythondユーザー定義関数(UDF)を記述し、それをサーバーレスのバックエンドを活用してあらゆる空間分析ワークフローを強化することができます。Fusedはラスターデータとベクターデータ両方を含む様々な種類のデータを受け入れます。一度データがFusedにアップロードされると、最も早く効率的にアクセスできるよう準備されます。このように、Fusedはデータをリアルタイムでグローバル規模で可視化することができるのです。
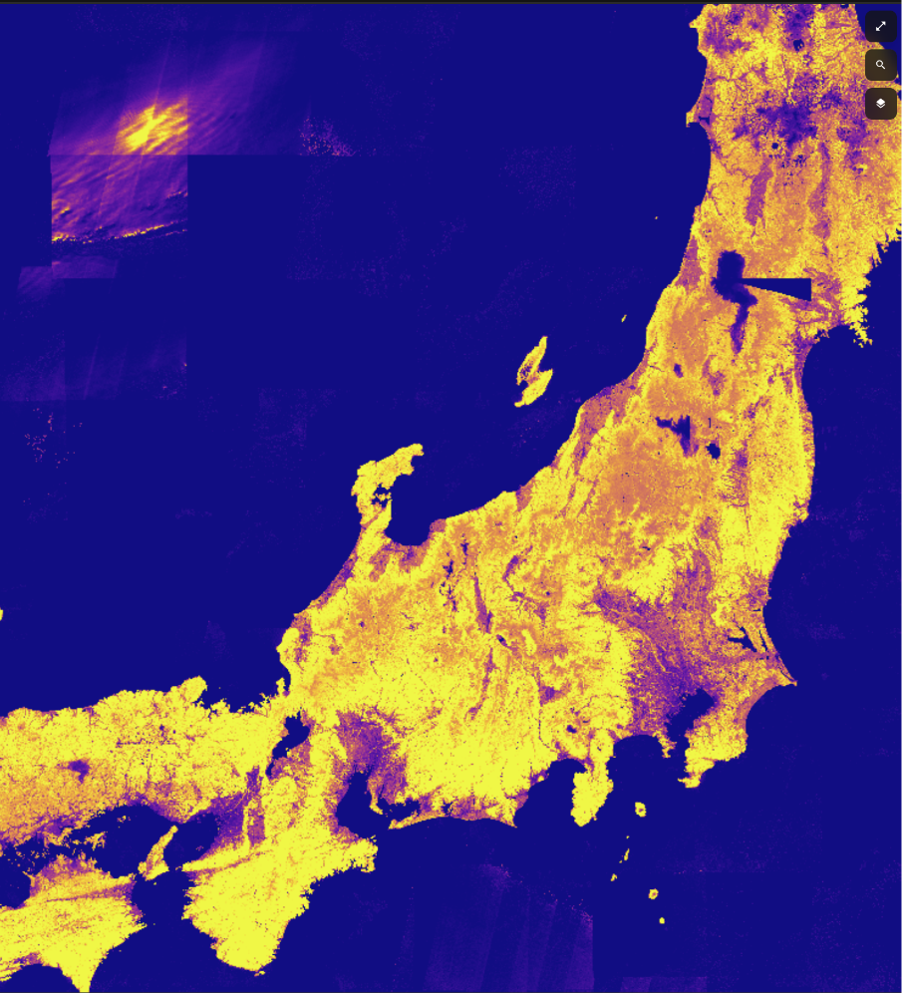
The below screenshot is taken from one of the many public UDFs created by the Fused community, visualizing the earth in thirteen different spectral bands (data provdided by the Sentinel-2 program).
以下のスクリーンショットは、Fusedコミュニティによって作成された多くの公開UDFの一つから取得したもので、地球を13種類のスペクトルバンド※1で可視化しています。(データはSentinel-2プログラム提供のものです)
※1…電磁スペクトルの特定の波長範囲を指します。リモートセンシングや衛生画像の解析においてスペクトルバンドは非常に重要であり、異なる種類の対象物や現象を検出・識別できます。可視光、赤外線、紫外線など、様々な範囲に分けられます。
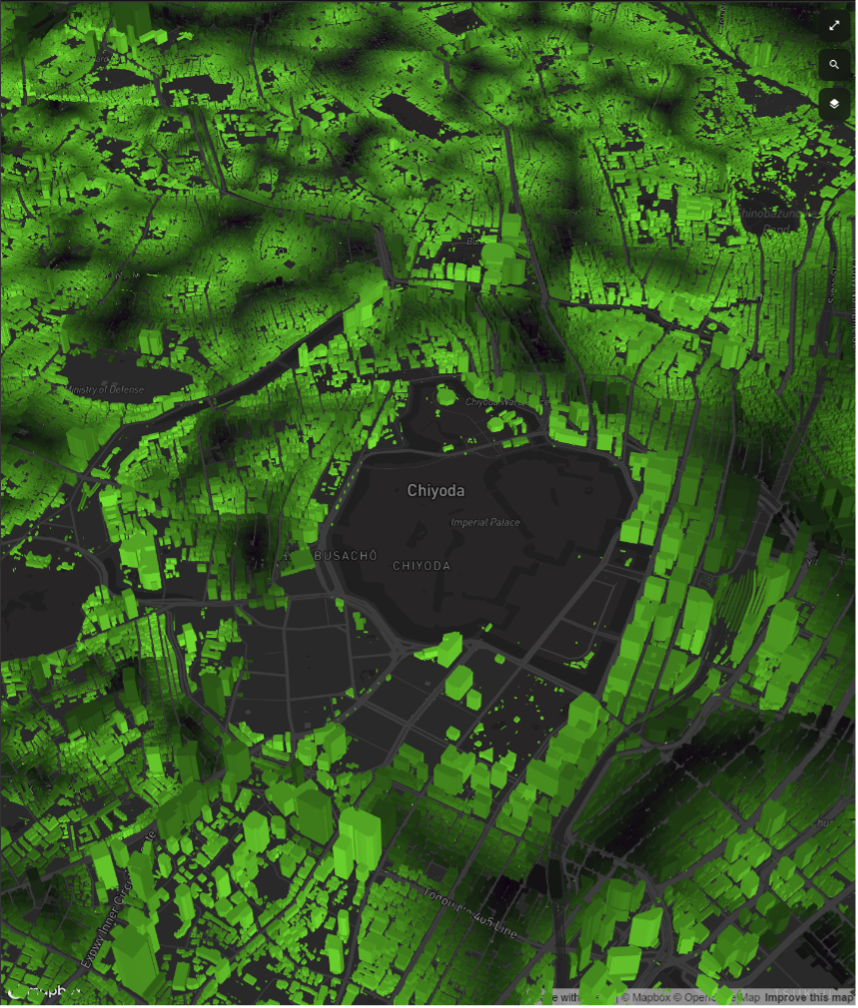
Drawing inspiration from some of these public UDFs we were able to create our own UDF using the opensource Japan building footprint data Flateau.
Here we combine vector and raster data to color the buildings in downtown Tokyo based on how far they are from nature/vegetation.
これらの公開UDFからインスピレーションを得て、私たちはオープンソースの日本の建物フットプリントデータ “Flateau” を利用して独自のUDFを作成することができました。このUDFでは、ラスターデータとベクターデータを組み合わせ、東京の中心部にある建物を自然や植生からの距離に基づいて色分けしています。
For a more extreme use case, we are currently also working with fused to optimize a geospatial workflow analyzing almost half a Trillion points!
With data at this scale it becomes incredibly important to optimize every small step of the data analysis pipeline, and fused is helping us achieve this.
さらに極端なユースケースとして、現在私たちはFusedを使用して、約5兆ポイントを分析する地理空間ワークフローの最適化に取り組んでいます。この規模のデータでは、データ分析工程のあらゆる小さな段階を最適化することが非常に重要なのですが、Fusedがこれを実現するのに役立っています。
Finally, when you have successfully finished your data analysis using Fused, your work can then easily be shared so that other people can interact with your code. Examples of sharing methods: HTTP endpoint, CURL, Python, Google Sheets, DuckDB.
最後に、Fusedを使用したデータ分析が正常に完了すると、それらを簡単に共有して、他の人がコードを操作できるようになります。共有方法として、HTTPエンドポイント、CURL、Python、Google Sheet、Duck DBがあります。
Fusedに関してご質問などございましたら、弊社サポート(https://pacificspatial.com/contact/)までお気軽にお問い合わせください。